Data visualization
What is Data visualization?
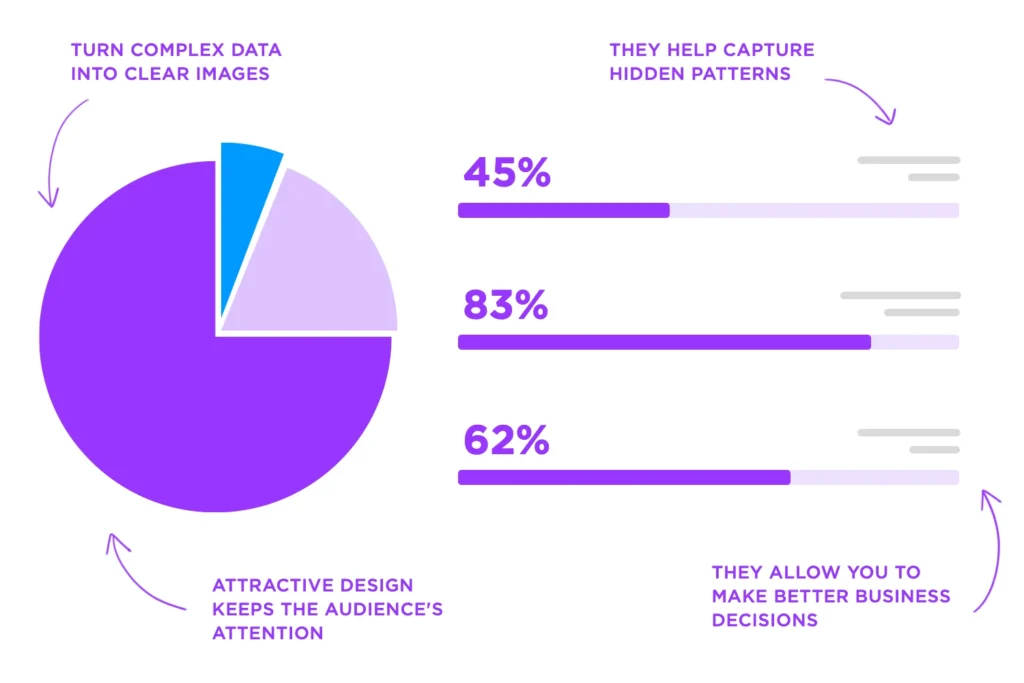
Data visualization is widely recognized as one of the most essential tools for converting complex datasets into visually appealing and easily interpretable formats. In today’s data-driven environment, vast amounts of information are collected and analyzed daily by organizations. As a result, effective data visualization serves as a vital link between raw data and actionable insights. Trends, patterns, correlations, and anomalies can be quickly identified through the use of visual elements such as charts, graphs, heatmaps, and dashboards. This makes data visualization invaluable across various industries, including business, healthcare, education, research, and digital marketing. Even the most complex datasets can be simplified and made more engaging, ensuring that insights are accessible to data analysts, business executives, marketers, and other professionals.

The ability of data visualization to enhance comprehension and clarity is considered one of its most significant advantages. Visual information is processed by people more easily than numerical or textual data. For instance, a line graph depicting steady sales growth over several years can be interpreted far more quickly than pages of raw numbers in a spreadsheet. This visual accessibility accelerates decision-making processes, allowing business leaders to identify opportunities and address issues without spending excessive time decoding datasets. Furthermore, visuals are inherently more engaging and memorable, making them highly effective for presentations, reports, and other communication channels.
Collaboration and teamwork are also significantly improved through data visualization. When data is presented in clear and understandable ways, stakeholders from diverse backgrounds are better able to participate in discussions. For example, a pie chart illustrating customer demographics can provide marketers with a comprehensive view, while a bar graph showcasing quarterly revenue comparisons can help financial analysts make informed decisions. By breaking down organizational silos, data visualization fosters alignment and ensures that everyone is working toward shared objectives.
The ability to uncover hidden insights is another key benefit provided by data visualization. Patterns and trends, often invisible in raw datasets, are revealed through visualization. For example, heatmaps can expose customer behavior patterns on websites, enabling marketers to optimize user experiences. Scatter plots may highlight correlations between variables, leading to meaningful conclusions and innovative solutions. These visualizations are instrumental in identifying opportunities, detecting weaknesses, and driving improvements. Additionally, modern tools allow users to interact with data by filtering information, drilling down into specific points, or exploring scenarios in real time. This interactivity makes data-driven decision-making more precise and actionable.
Despite its numerous advantages, data visualization is not without its challenges. Poorly designed visualizations, whether intentional or accidental, can mislead audiences. Incorrect scaling, improper representations, or the use of unsuitable chart types can distort data and result in inaccurate interpretations. Overloading a visualization with excessive information or complex designs can confuse viewers rather than clarify insights. For example, while 3D pie charts may appear visually impressive, they often make it more challenging to interpret proportions accurately compared to simpler 2D designs. Ensuring that visualizations strike a balance between aesthetics and functionality is essential.
Another limitation lies in the dependence of data visualization on the quality of the underlying data. No matter how visually compelling a chart or graph may appear, flawed, incomplete, or biased data will produce unreliable insights. This makes data cleaning and preprocessing critical steps in the visualization process. Ethical considerations must also be prioritized to ensure transparency and honesty in the presentation of data. Trust is built through accuracy and integrity, especially when visualizations influence significant decisions.
Selecting the appropriate type of chart or graph is essential for effective data visualization. Each type serves a specific purpose. For instance, bar charts are widely used for comparing values across categories, while line graphs are ideal for illustrating trends over time. Pie charts are suitable for showing proportions but should be limited to scenarios with a few categories for clarity. Scatter plots work effectively to represent correlations between two variables, and heatmaps are excellent for visualizing patterns or intensity within datasets. The right choice of visualization format ensures that data is communicated clearly and meets the intended objectives.
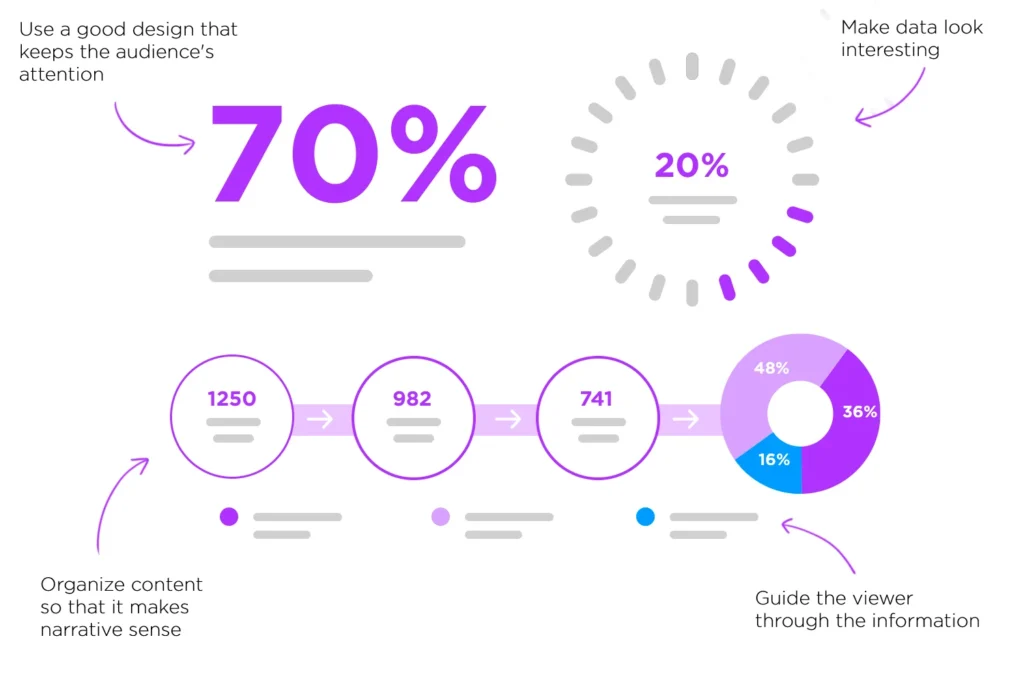
Design principles also play a critical role in ensuring the effectiveness of data visualizations. Simplicity and clarity should always take precedence. Unnecessary elements such as excessive gridlines, distracting patterns, or decorative features should be avoided, as they may detract from the core message. Colors should be used strategically to emphasize key information, while overuse of multiple hues should be avoided to prevent overwhelming the audience. Labels for axes, data points, and legends must be clear and concise to make interpretation intuitive. Consistency in styles, fonts, and color schemes across visualizations contributes to a professional and cohesive presentation.

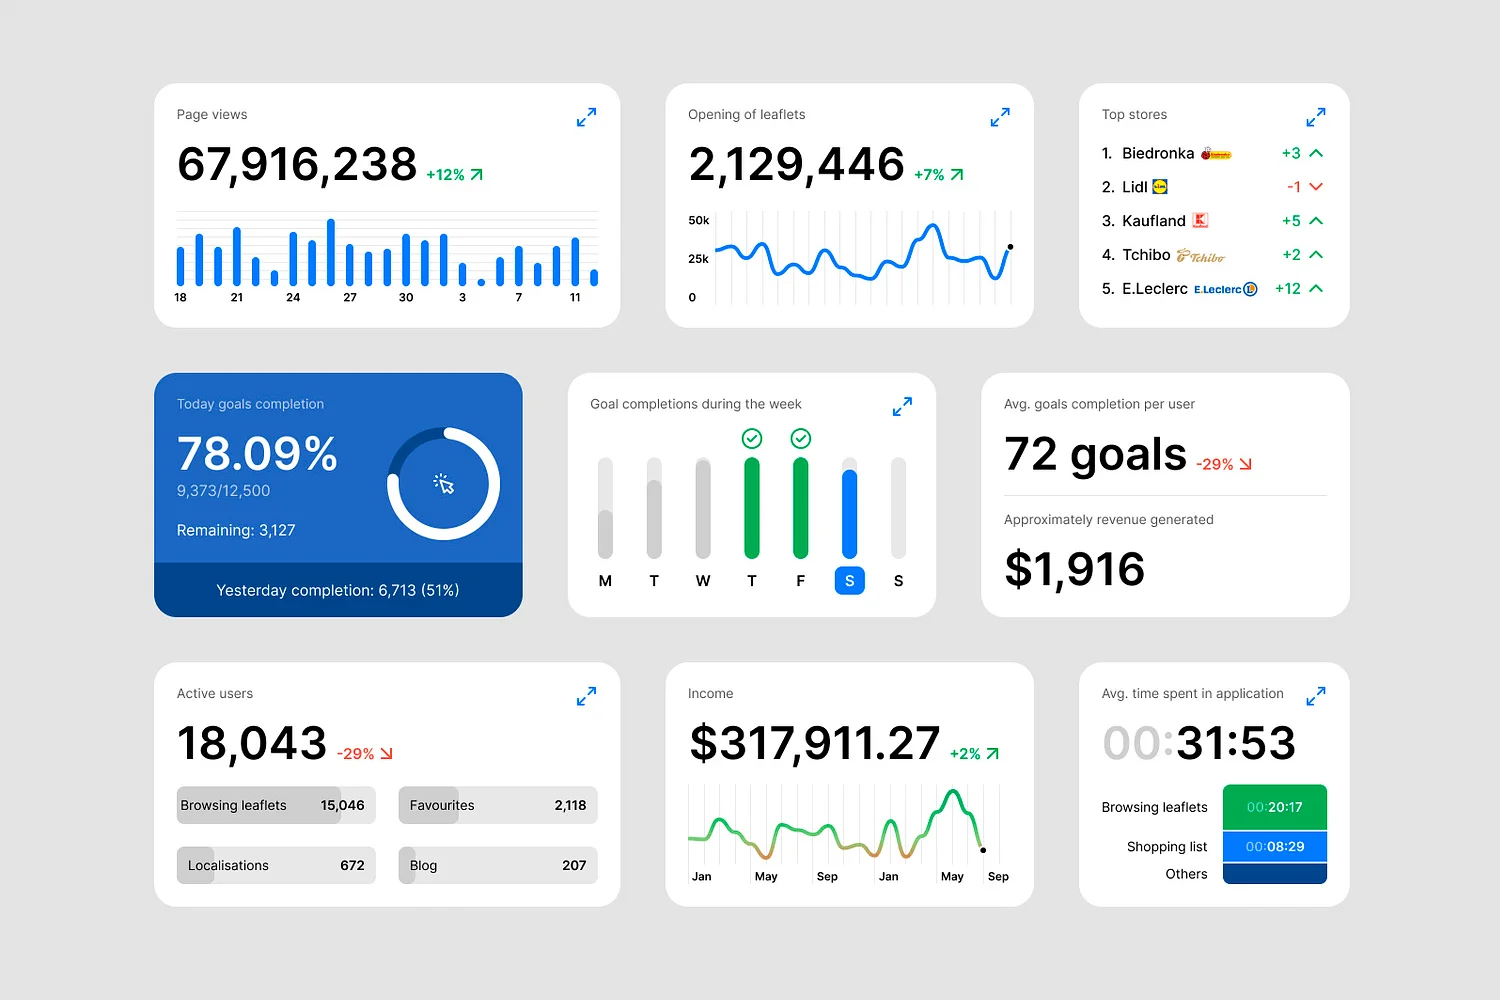
Interactive features in data visualization tools have revolutionized the way data is analyzed and presented. Tools like Tableau, Power BI, and Google Data Studio are widely used for creating dynamic dashboards. These tools allow users to filter data, zoom into specific details, and compare scenarios in real time. By adding interactivity, deeper insights can be uncovered, which might otherwise remain hidden in static charts. This level of engagement enhances the overall utility and impact of data visualization.
In conclusion, data visualization is an indispensable tool in today’s data-rich world. It empowers individuals and organizations to transform raw data into actionable insights, leading to more informed decision-making and better communication. By improving understanding, uncovering hidden trends, and encouraging collaboration, data visualization has established itself as a cornerstone of modern analytics. However, its effectiveness depends on thoughtful design, ethical practices, and a commitment to accuracy. When executed correctly, data visualization not only informs but also inspires, enabling users to unlock the full potential of their data. Whether used for tracking business performance, exploring research findings, or refining marketing strategies, data visualization continues to prove itself as one of the most impactful ways to bring data to life and tell compelling stories.