
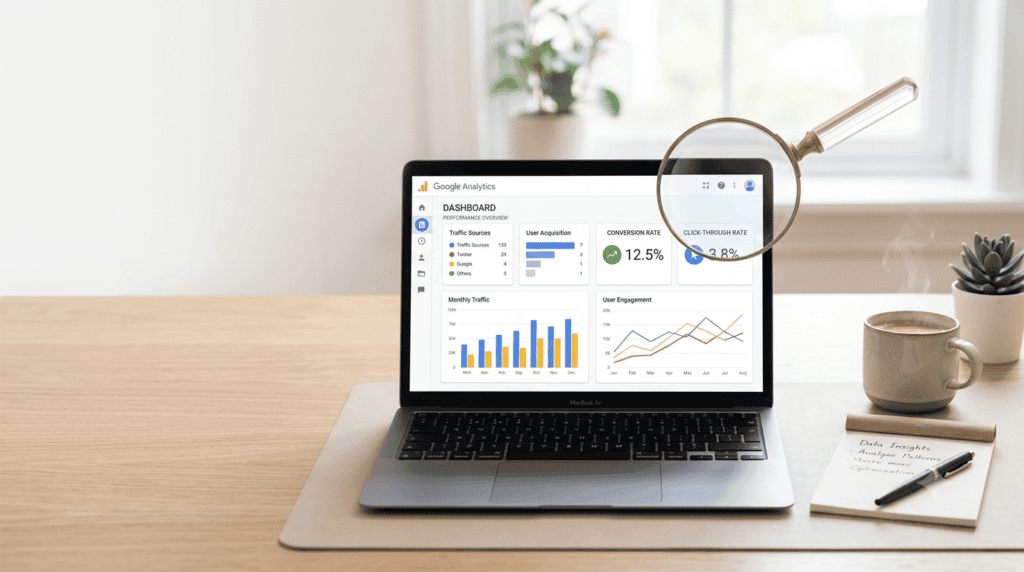
You log into Google Ads, click on a campaign, and you’re staring at a wall of numbers. Impressions, CTR, CPC, Conv. Rate, Cost/Conv, Quality Score. Somewhere in there is an answer to the only question you actually care about — is this campaign making or losing me money — but the dashboard doesn’t say that anywhere.
Most business owners either ignore the report entirely and just check “did I get calls this week,” or they stare at it for ten minutes, feel slightly panicked, and close the tab. Neither gets you closer to knowing if your budget is working.
Here’s how to actually read it, using only the five numbers that matter.
Start With Cost Per Conversion, Not Cost Per Click
Cost Per Click (CPC) is the number everyone fixates on because it’s the first big figure on the dashboard. It tells you almost nothing on its own. A ₹5 click that never converts is more expensive than a ₹40 click that turns into a customer.
The number that actually matters is Cost Per Conversion — how much you’re paying, on average, for one lead, call, or sale. Find your campaign’s total spend for the month and divide it by the number of conversions. If that number is lower than what a customer is actually worth to your business, the campaign is working. If it’s higher, something needs to change.
Check Conversion Rate Before You Blame the Ads
If your Cost Per Conversion looks too high, the instinct is to blame the ad copy or the targeting. Often the real problem is somewhere else — the website.
Conversion Rate tells you what percentage of people who clicked your ad actually took action — filled a form, called, or bought something. If your click volume is healthy but your conversion rate is low (under 2-3% is generally weak for most industries), the ad is doing its job. It’s bringing people to your site. The site isn’t closing them.
This is one of the most common things we see when businesses come to us frustrated with Google Ads: the campaign was never broken. The landing page was.
Click-Through Rate (CTR) Tells You If the Ad Itself Is Working
CTR is the percentage of people who saw your ad and clicked it. This is the one number that’s purely about the ad — not your website, not your pricing, not your sales team.
A low CTR (under 2%) usually means one of two things: your ad copy isn’t compelling, or your ad is showing to the wrong audience. A high CTR with a low conversion rate means the opposite problem — people click, but the page or offer doesn’t match what the ad promised.
Quality Score Is Google Quietly Grading You
Quality Score is a 1-10 rating Google gives each keyword, based on your ad relevance, expected CTR, and landing page experience. Most business owners never check it, but it directly affects how much you pay per click — a higher Quality Score means Google charges you less for the same ad position.
If your Quality Score is sitting at 3 or 4 across most keywords, you’re likely overpaying for clicks compared to a competitor bidding on the same terms with a Quality Score of 7 or 8. This is usually fixable — tighter keyword-to-ad matching and a landing page that actually reflects the ad’s promise.
Impression Share Tells You What You’re Missing
This one doesn’t show by default — you may need to add it as a column. Impression Share tells you what percentage of all possible times your ad could have shown, it actually did. If you’re at 40% impression share, your ad is missing 60% of the opportunities it’s eligible for — usually because of budget limits or a lower ad rank.
A low impression share on a campaign with a good conversion rate is often the clearest sign that more budget, not a different strategy, is what will grow results.
A Simple Way to Read Your Report Each Week
You don’t need to check Google Ads daily. A short weekly look at these five numbers tells you almost everything:
- Cost Per Conversion — is it going up or down compared to last week?
- Conversion Rate — is the site converting clicks, or just collecting them?
- CTR — are people finding the ad relevant enough to click?
- Quality Score — are you paying more than you need to?
- Impression Share — are you missing opportunities because of budget?
If four of these five look healthy and one doesn’t, you usually know exactly where the problem lives — the ad, the landing page, the budget, or the targeting — instead of guessing at the whole campaign.
The Bottom Line
Google Ads reporting isn’t complicated once you know which five numbers to actually look at. Most businesses don’t have a Google Ads problem — they have a “nobody’s reading the report properly” problem, which quietly burns budget for months before anyone notices.
At AIMS Digital, we manage Google Ads campaigns with this exact level of visibility built in — no jargon, no guessing, just a clear weekly picture of what’s working and what isn’t. If you’re currently running ads and aren’t sure whether your budget is actually paying off, we’re happy to take a free look at your account and tell you honestly what we see.